
The Quality Check: Getting up and running 🏃♂️ with DQX (Part 2)


There are two primary ways to install DQX, and I will walk you through each method. While the official documentation mentions three, the first and second methods are functionally similar, offering the same outcome through slightly different approaches.
Before we dive into installation, do you already have a Databricks workspace? If not, let's quickly set one up for you.
One of the recent updates to Databricks is the ability to create a Free Edition account at no cost (I like freebies!). To sign up, follow the steps provided here. The free edition account gives you access to a Serverless compute that allows you to "test and design data pipelines." This compute is exactly what we will be using to install DQX 🙂.
Now, let's explore the installation options. While our demonstrations will focus on using DQX in Databricks, remember that if installed as a standalone library, it can be used with any Spark engine (At the moment, it seems to work only with Databricks)
Option 1: Install DQX as a Standalone Library
If you are familiar with Python, it's similar to how you'd install libraries in a Jupyter notebook.
%pip install databricks-labs-dqx
Alright, let's do that now, in our Databricks Workspace
Now that we have DQX installed, let's perform a simple data quality check. To do this, we will be using the 'Row-level checks' defined programmatically using DQX classes.
While DQX offers various powerful ways to define your data quality rules (including other Python classes like `DQRowRule` or `DQColRule`, SQL-based checks, or even defining rules in YAML files or from Delta tables for dynamic configurations), for this introductory post, we'll focus on this programmatic example to get you started.
from databricks.labs.dqx import check_funcs
from databricks.labs.dqx.engine import DQEngine
from databricks.sdk import WorkspaceClient
from databricks.labs.dqx.rule import DQForEachColRule

# Create a sample DataFrame

data = [
    ("Alice", 1, "USA"),
    ("Bob", 2, "Canada"),
    ("Charlie", None, "Mexico"),
    (None, 4, None),
]

columns = ["Name", "ID", "Country"]

input_df = spark.createDataFrame(data, columns)

# Defining a simple data quality rule for 3 columns to check that the Country, ID and Name columns are not null.

checks = [
    *DQForEachColRule(
        criticality="error",
        check_func=check_funcs.is_not_null,
        columns=["Country", "ID", "Name"],  # Apply to multiple columns
    ).get_rules()
]

print("Original DataFrame:")
display(input_df)

# Create a DQEngine instance using the Databricks Workspace client
# This ensures DQX can interact with your Databricks environment's services.
dq_engine = DQEngine(WorkspaceClient())

# Run the data quality check
valid_df, quarantine_df = dq_engine.apply_checks_and_split(input_df, checks)

print("\nValid Rows (passed all checks):")
display(valid_df)

print("\nQuarantined Rows (failed one or more checks):")
display(quarantine_df)
You can view the script above here
Option 2: Install DQX as a Tool in your Databricks Workspace
This option gives you access to a built-in dashboard for viewing your data quality checks.
First, you need to have the Databricks CLI installed on your local machine. You can find the installation steps here.
Next, you'll need to configure the Databricks CLI to authenticate with your workspace. This allows your local machine to communicate with your Databricks environment. If your CLI is already configured, you can skip this step.
To configure the Databricks CLI, run the following in your terminal:
databricks configure
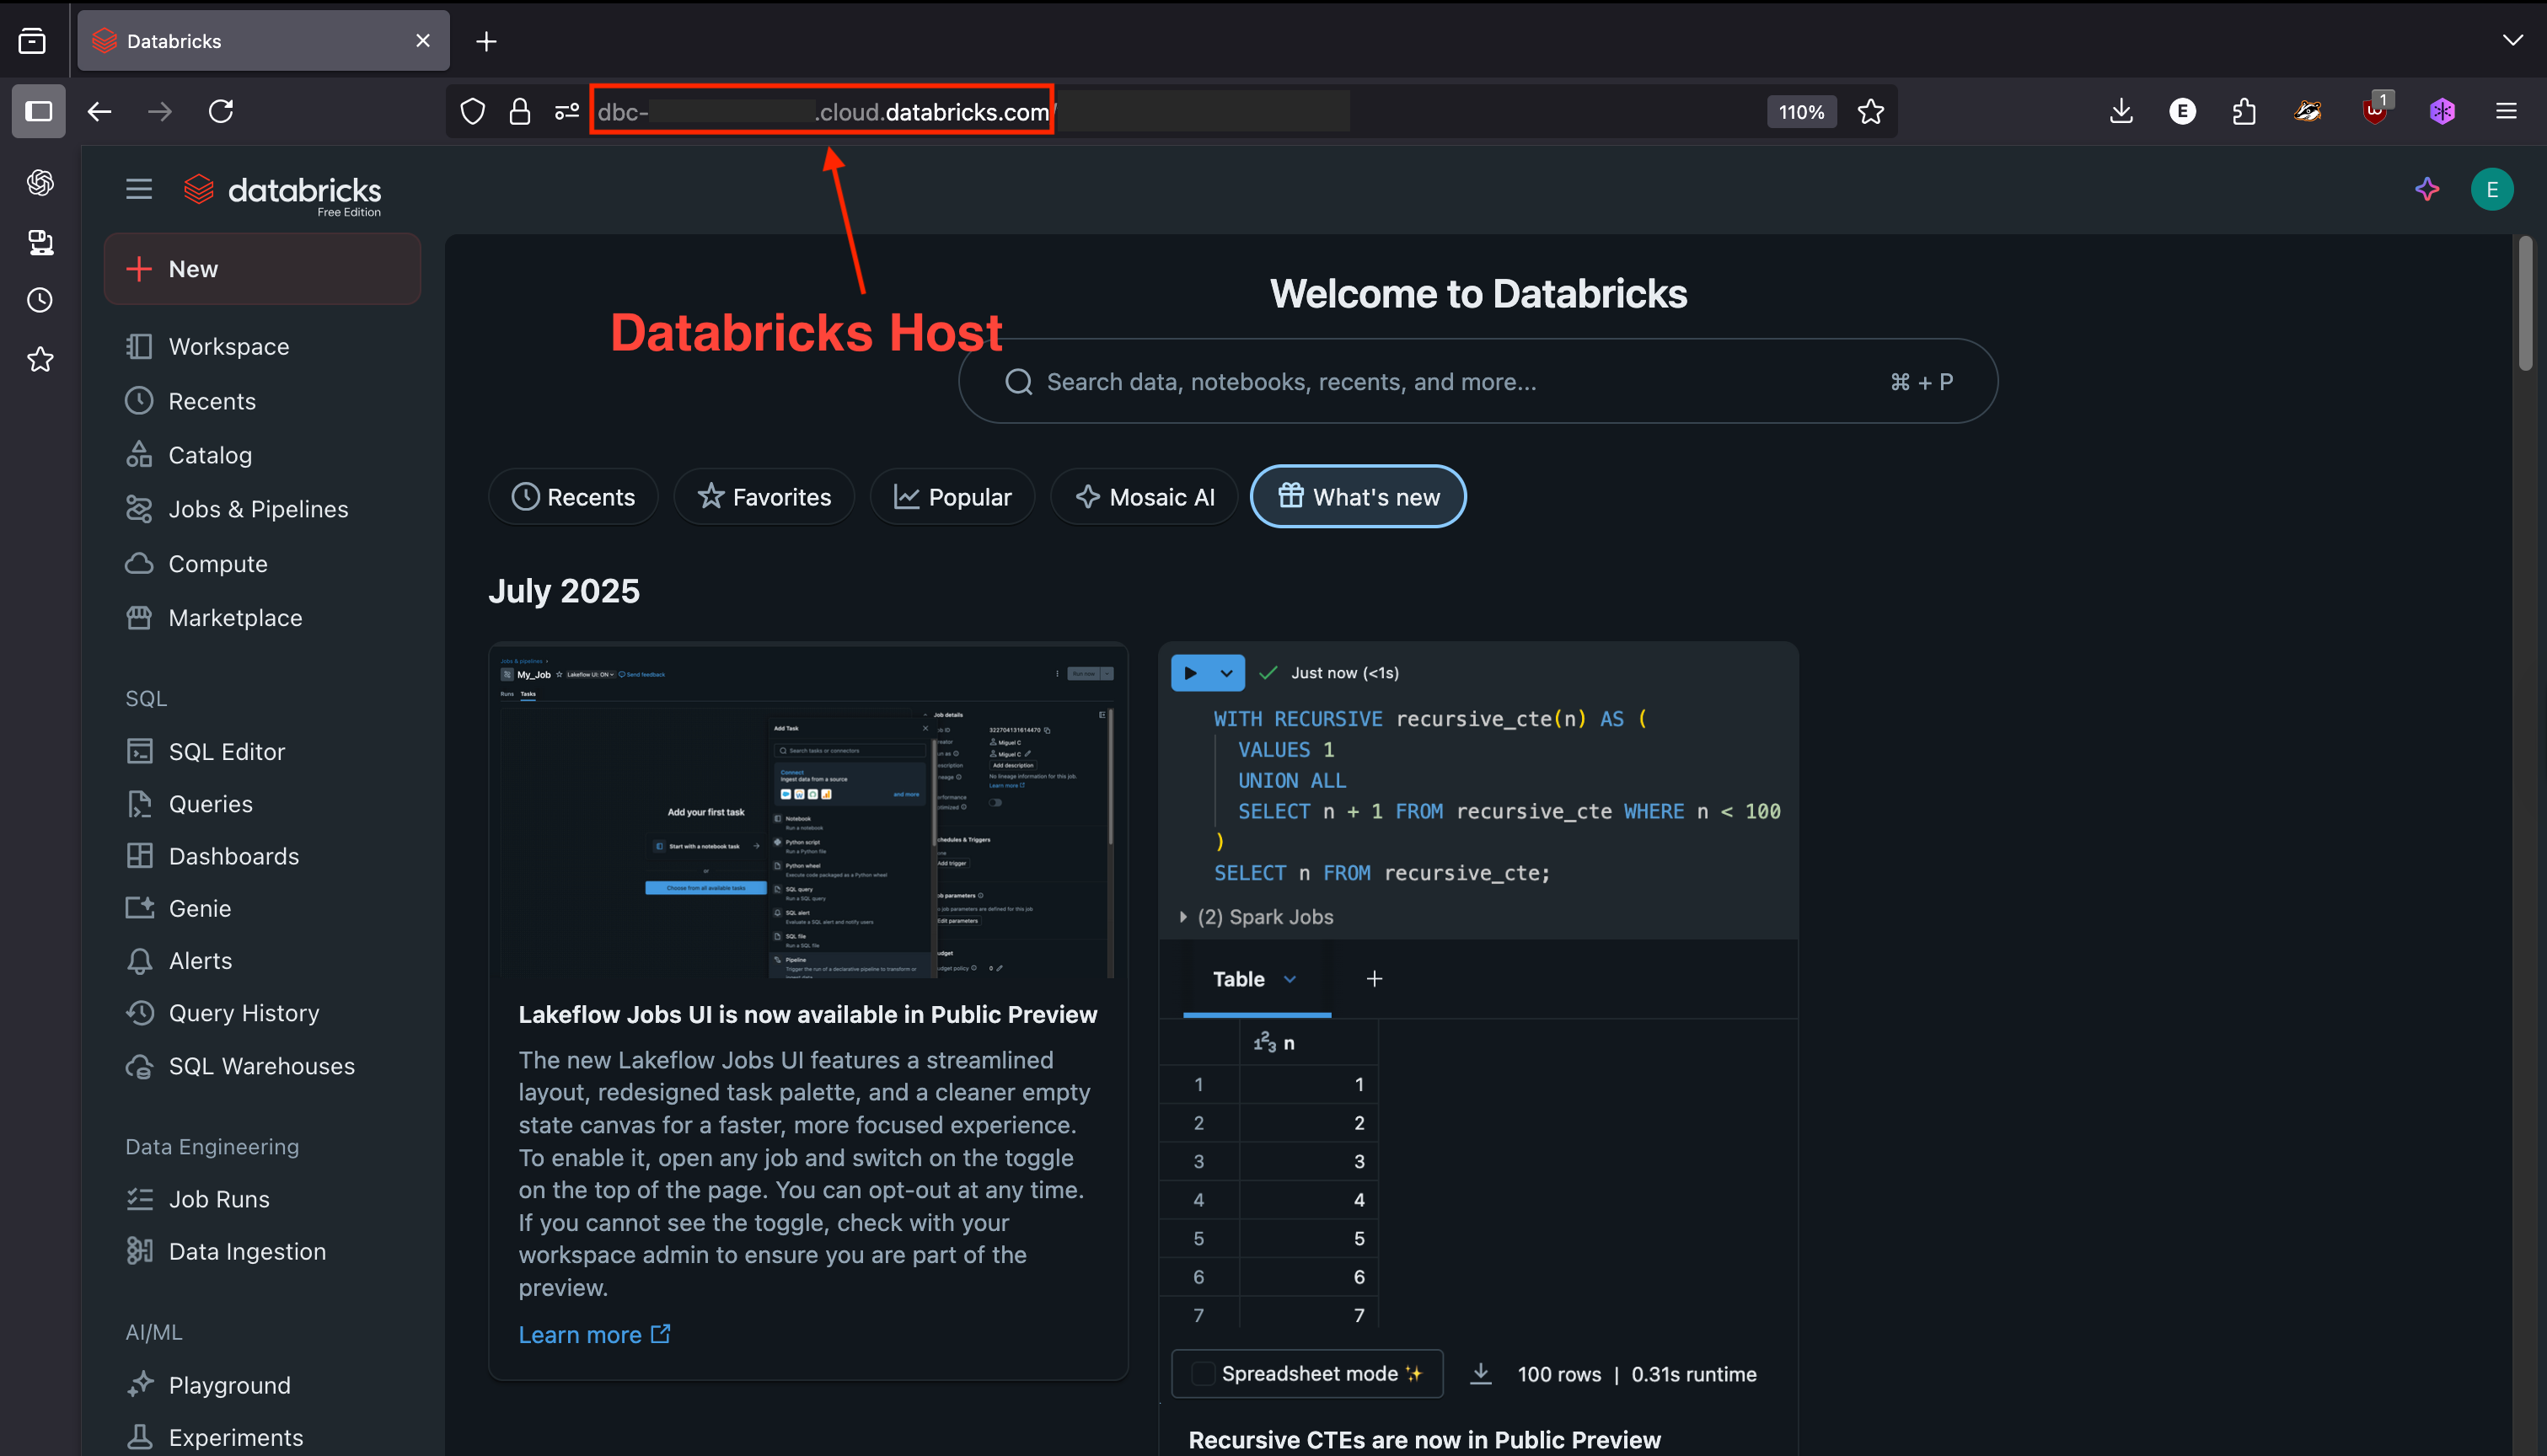
You'll be prompted for a Databricks host, which you can find in the address bar in your browser
Once the CLI is configured, install DQX as a tool in your Databricks workspace by running the following in your terminal:
databricks labs install dqx
Don't worry if this step seems complicated; we'll explore it further in the next series.
When to use each Option?
Option 1 (Installing as a standalone library): This is the best choice if your goal is to build customised dashboards or add specific logic using the results of your quality checks. The main difference is that you won't have access to the prebuilt DQX Dashboard that comes with the workspace tool installation. However, you will still be able to view the quality results, and the library installation is linked specifically to the Spark cluster where it's installed.
Option 2 (Installing as a tool): This option is more geared towards Databricks environments, as it involves installing DQX directly as a workspace tool. The key advantage of this method is that it allows you to view your data quality checks within an already-built dashboard, providing a seamless experience within Databricks.
You can see more demos in the DQX guides here
What's Next in this Series?
You've successfully installed DQX and performed your first data quality check! This post covered the foundational steps to get DQX up and running.
In our next blog post, we'll dive into one of DQX's most powerful features: the built-in Data Quality Dashboard. We'll walk you through how to prepare your DQX checks to appear here, giving you a comprehensive visual overview of your data's health. We'll also start to delve into the anatomy of a DQX check, explaining the key components that power your data quality rules.
This will equip you to not only enforce data quality but also to monitor and understand your data's integrity with ease. Stay tuned! 🙂
Please note: This article reflects my personal views and experiences with DQX. I am not employed by or officially affiliated with Databricks, and the opinions expressed herein are my own.